Visual Science Communication
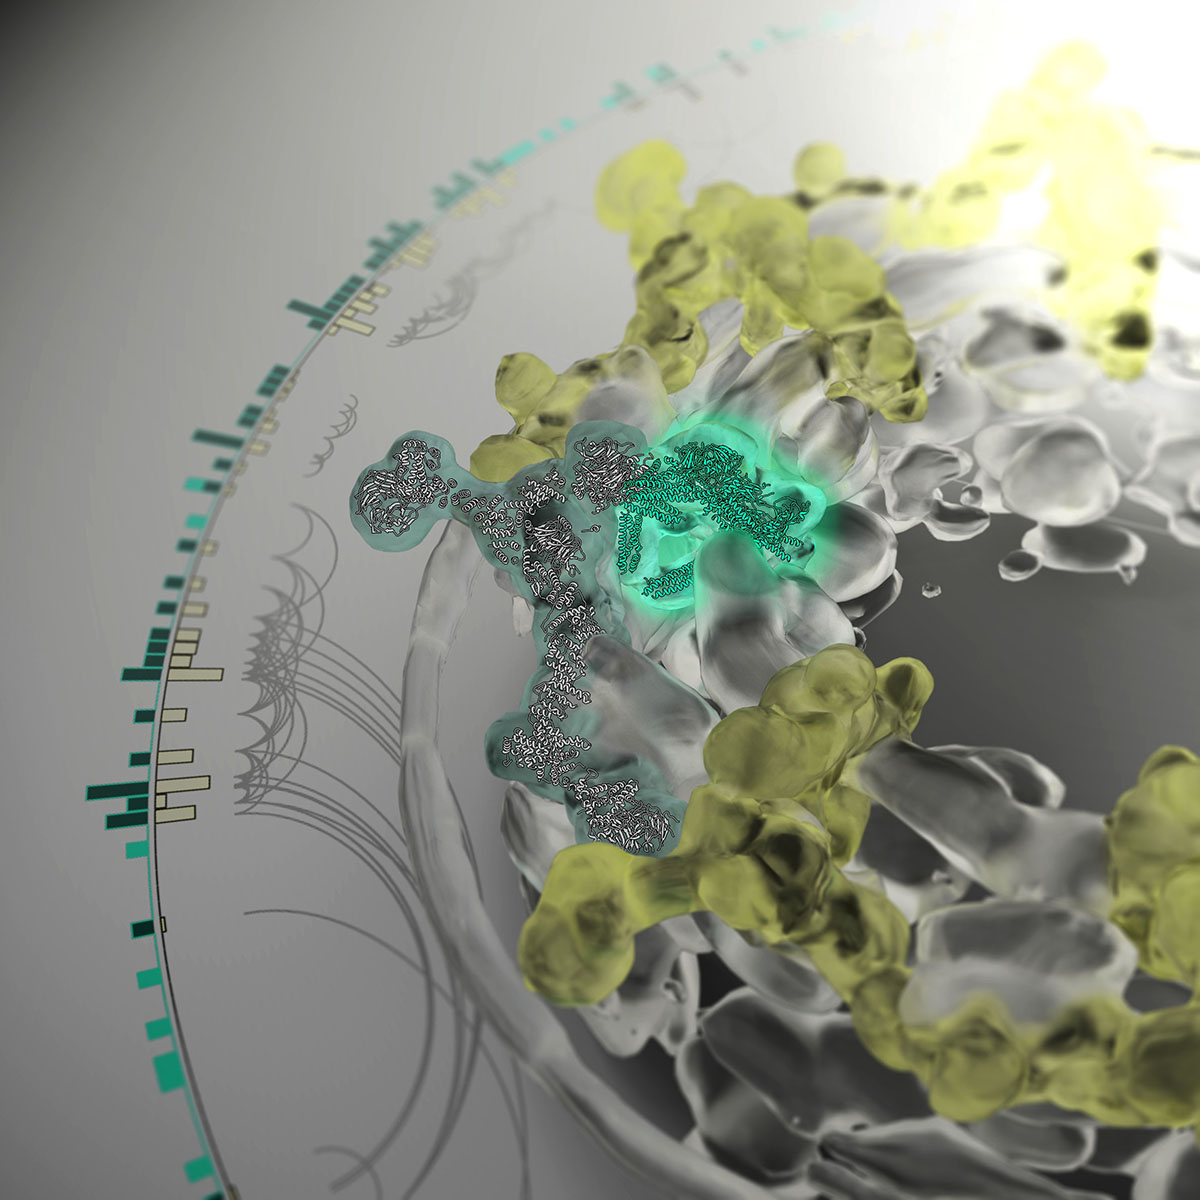
- This rendering illustrates how scientists determined parts of the structure of the RNA export platform, and its relative position within the nuclear pore complex
- The circular plot symbolizes the interaction analysis between different proteins
- Client: Laboratory of Cellular and Structural Biology, The Rockefeller University (2016)
- Software: Cheetah 3D, UCSF Chimera, and Adobe Photoshop
Interactive Visualization of Research Areas
- Interactive organization chart that maps principal investigators to their research areas
- Live examples:
- Client: ETH Zurich (2017 / 2021)
- Software: D3.js
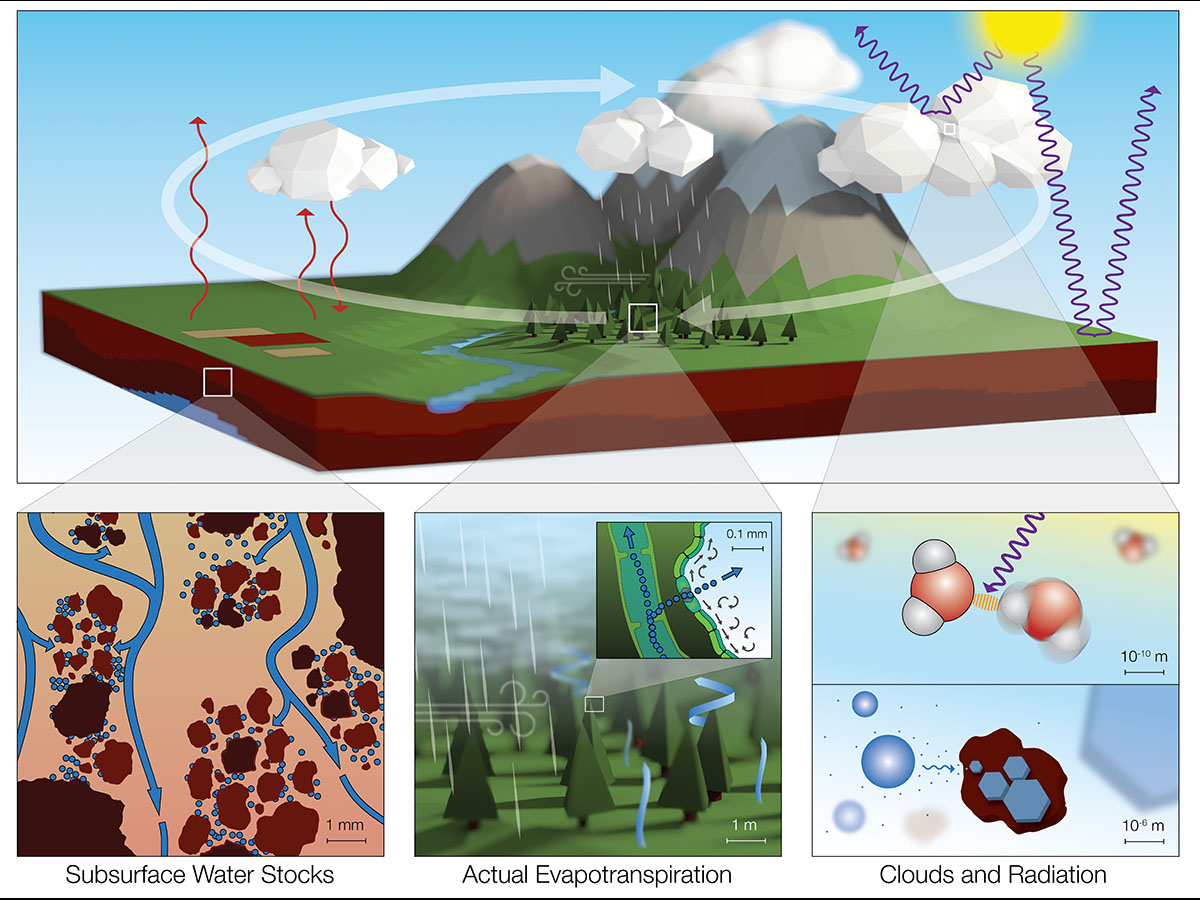
- Illustration on key processes in the hydrological cycle
- Client: Prof. Corinna Hoose, Karlsruhe Institute of Technology (2017)
- Software: Adobe Illustrator and Blender
Tutorial: Creating Web-Based Interactive Molecular Visualizations
- Online tutorial on how to create a flexible and fully customizable 3D visualization that allows anyone with access to the internet to explore a biomolecule interactively
- Client: Gaël McGill for clarafi.com (2017)
- Software: three.js and UCSF Chimera
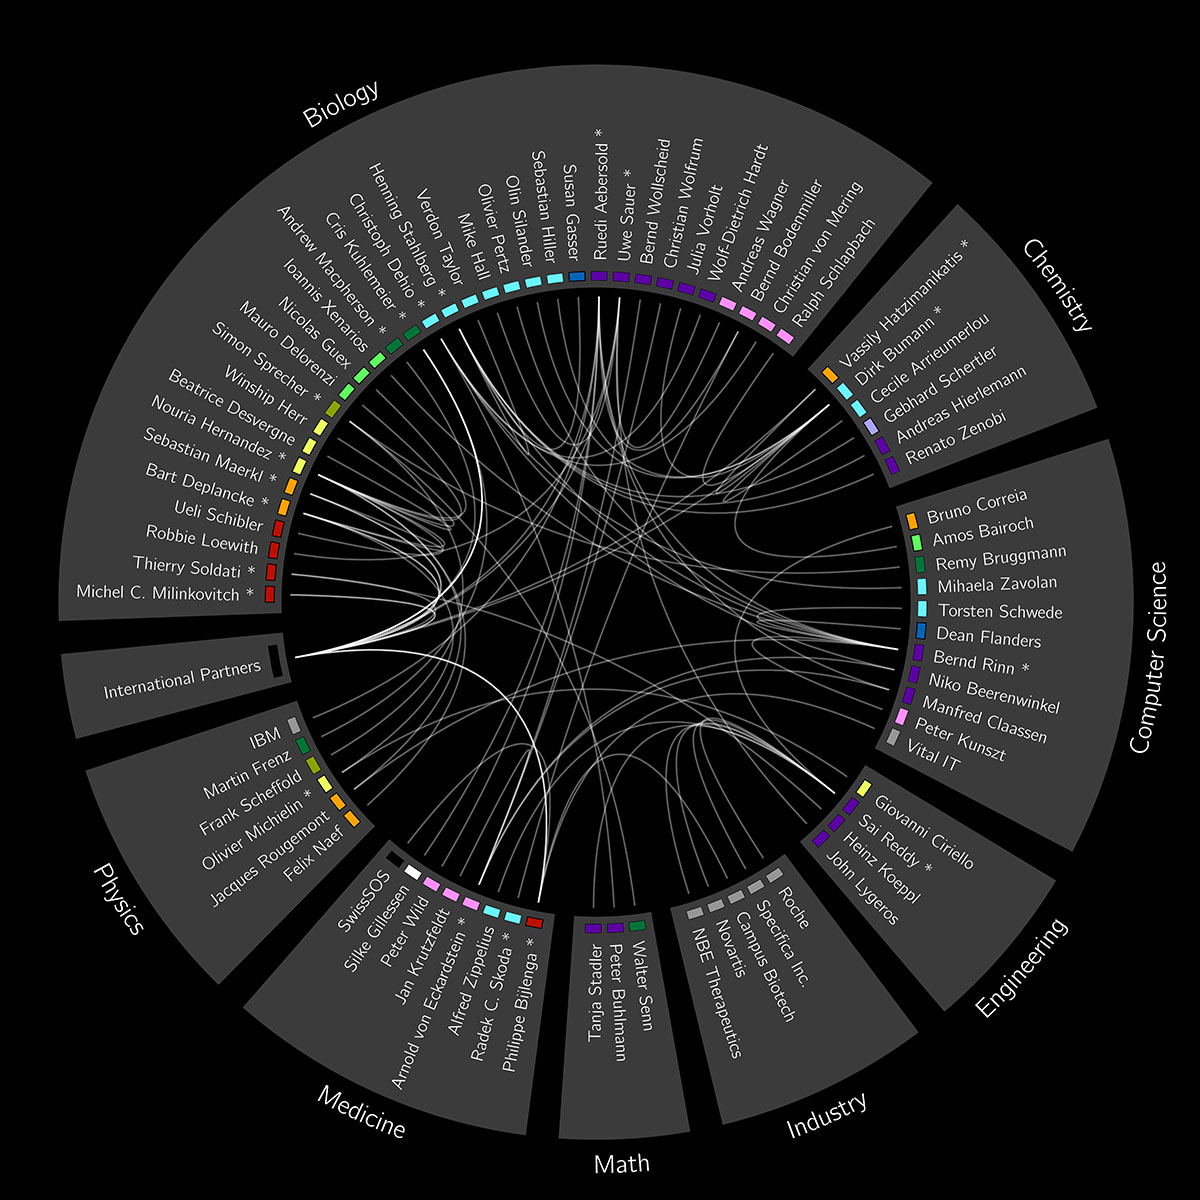
Collaborative Network in Swiss Systems Biology
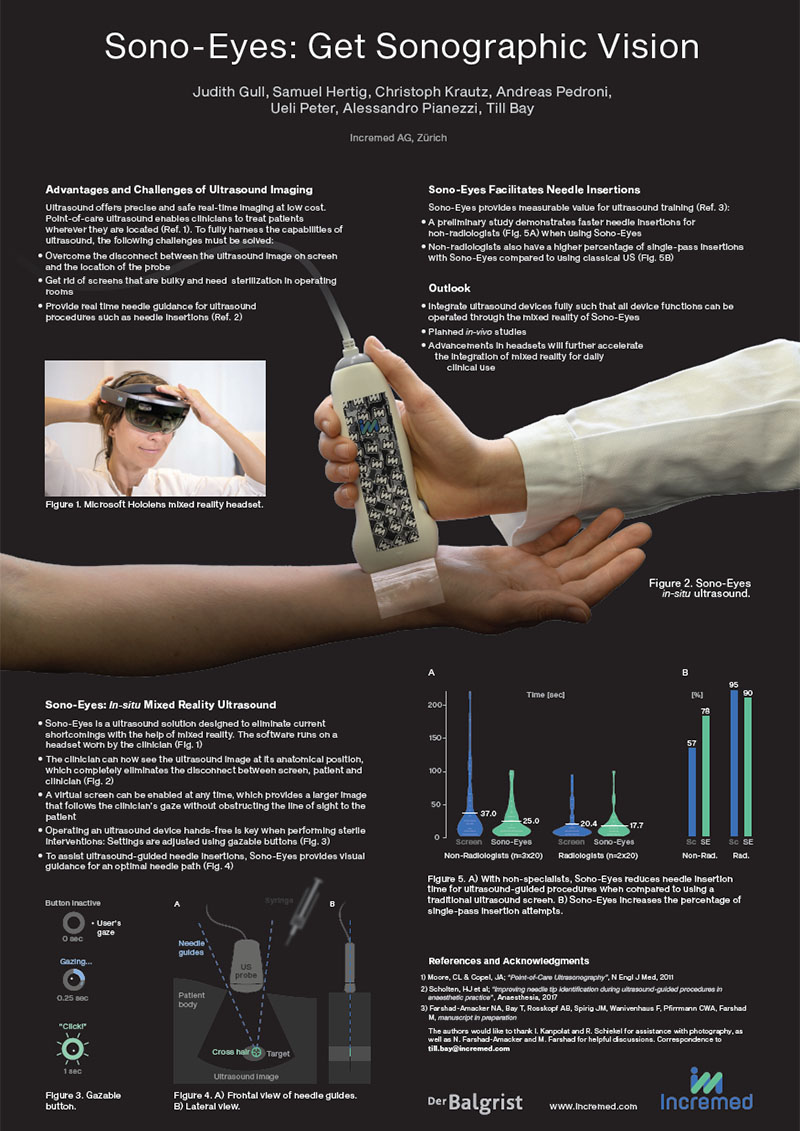
SonoEyes: Get Sonographic Vision
- Scientific poster on SonoEyes, a mixed reality application for the Microsoft HoloLens; presented at the Swiss Medtech Day 2019
- High-resolution pdf
- Created for Incremed AG (2019)
- Software: Adobe Illustrator
- Scientists and artists teamed up with the argovia philharmonic orchestra to create the collabrative audio-visual art piece The Sound of Molecules, stimulating the societal debate about the ethical challenges of synthetic biology
- Client: NCCR Molecular Systems Engineering, University of Basel (2017)
- Software: Adobe AfterEffects
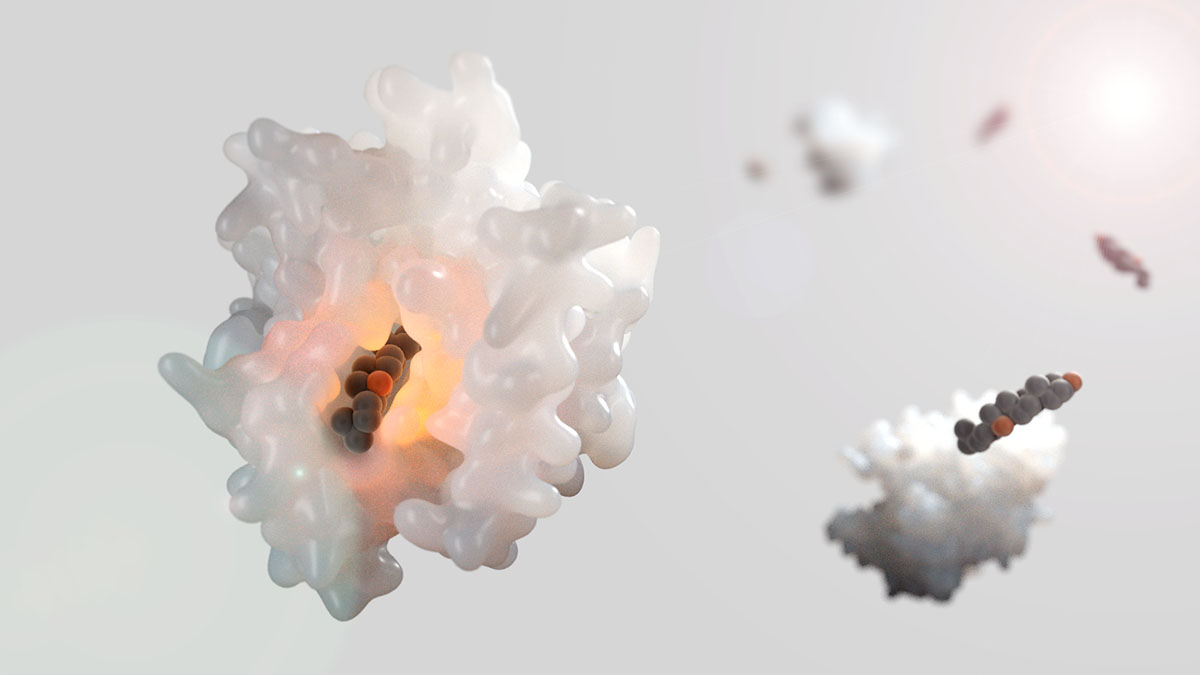
- Visualization of a hydroxycholesterol molecule bound to an oxysterol-binding-protein, which is implicated in signal transduction pathways in both yeast and humans
- Client: California Institute of Technology (2019)
- Software: Autodesk Maya and UCSF Chimera
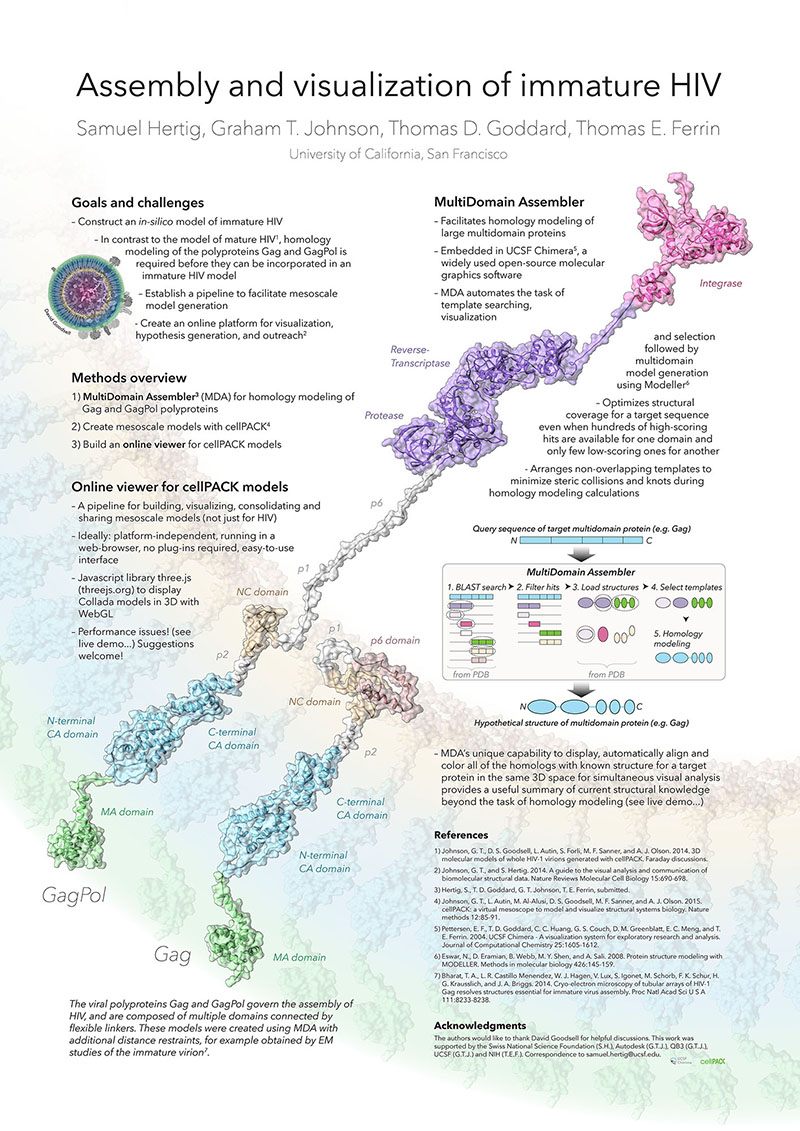
Structural Biology of HIV
- Scientific poster on the molecular structure of the immature HI virion
- Presented at the conference series Visualizing Biological Data (VIZBI) 2015, earned the best poster award
- High-resolution pdf
- Created for University of California, San Francisco (2015)
- Software: Adobe Illustrator and UCSF Chimera
- Interactive visualization illustrating the structural mechanism of CRISPR gene editing (web experiment, 2017)
- Software: three.js and UCSF Chimera
Fibronectin as a Mechanosensor
- Video illustrating the structure of a HI virus in blood serum
- Created for a competition hosted on cgsociety.org (2013)
- Tools: Lego bricks and autoPACK (Graham Johnson et al.)
-
Offering interactive visualizations, graphics, and videos for selected clients, with an emphasis on visual communication of data and concepts in science and technology
-
Leading workshops and seminars on the topics of: Scientific Poster Design, Best Practices for Scientific Visualization, Interactive Data Visualization with D3.js, and Adobe Illustrator for Scientists
-
Selected clients include: ETH Zurich, Stanford University, CalTech, Universidade de Lisboa, Uni Basel, and Comerge AG
-
My publications on Google Scholar
-
Other creative endeavors: Photography, bass player for TonTopf
-
Currently working as the quality manager for medical software at Comerge AG, Zurich, Switzerland.
